Thursday 11:30 a.m. · Sagewood
Real-Time Data
Visualization in Blazor
Tim Purdum · TechBash 2026
Your data has a heartbeat, and your dashboard can keep up with it.
GeoBlazor Core 4.6.2Blazor WebAssemblyASP.NET Core SignalR
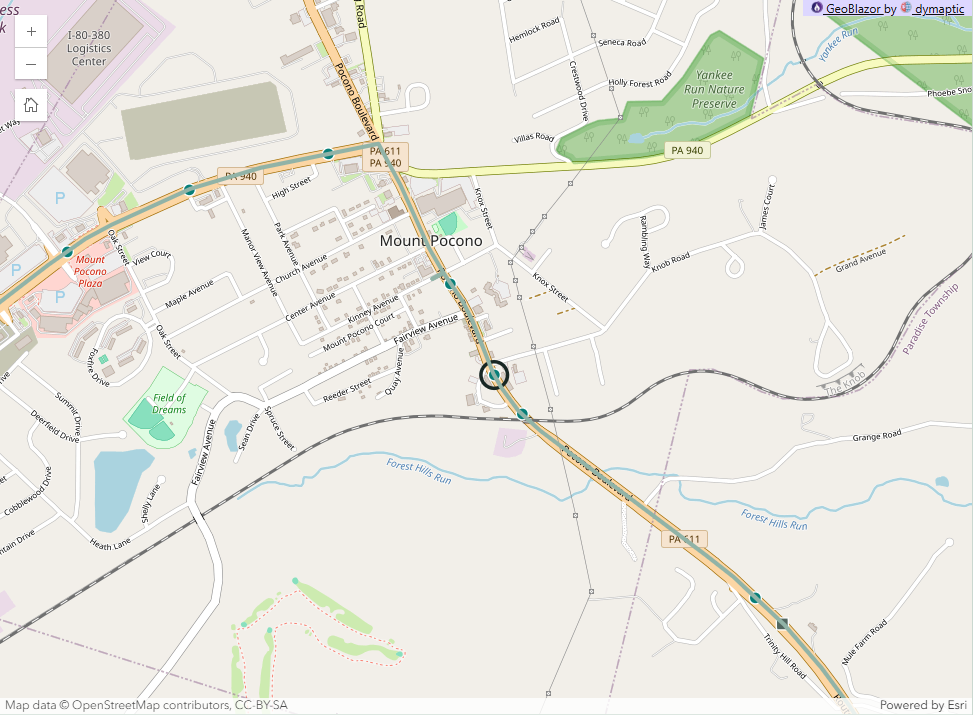
Live · simulated telemetry
Which vehicles need attention?
TRUCK 007
- Position
- 41.0621, −75.3390
- Speed
- 42 km/h
- Last report
- 0.4 s ago
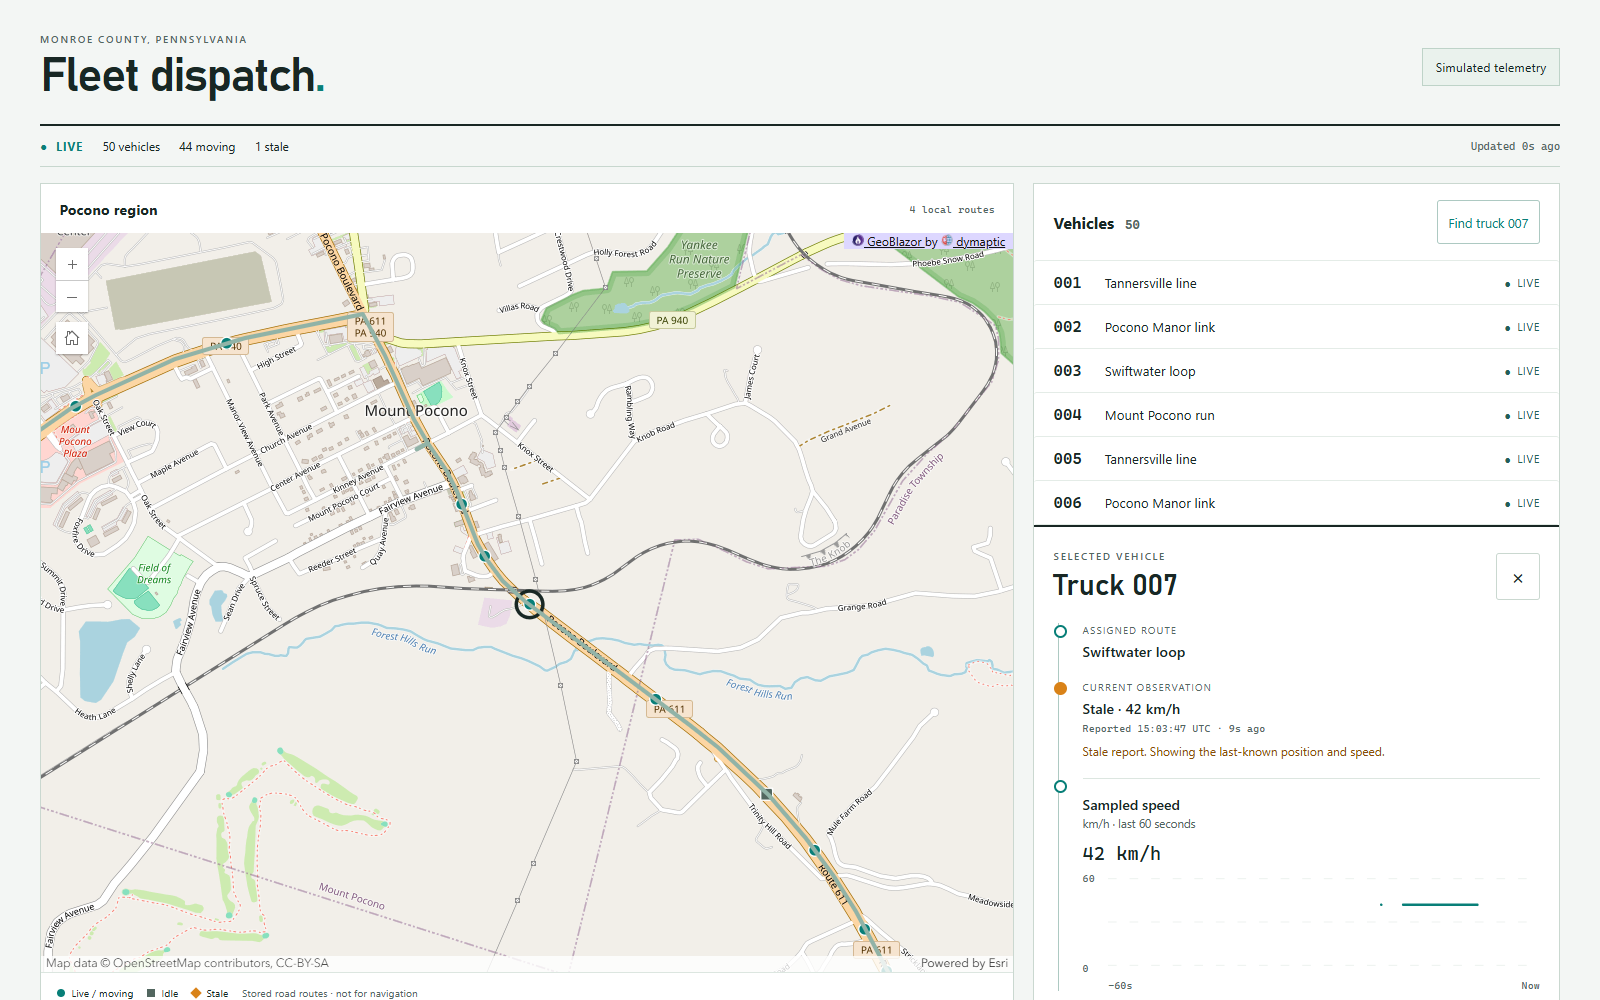
TRUCK 007
- Position
- last known 41.0588, −75.3407
- Speed
- 42 km/h (last report)
- Last report
- 12 s ago
Synthetic stress, not real truck behavior.
Interactive ArcGIS maps in Blazor, from C#
No hand-written JavaScript.
Core
Open source · this whole demo
Pro
3D
The map already knows how to draw.
You decide what to hand it, and how often.
Learn more
Websitegeoblazor.com
Documentationdocs.geoblazor.com
Samplesgithub.com/dymaptic/GeoBlazor-Samples
Core sourcegithub.com/dymaptic/GeoBlazor
Live demo
Six stages from truck to map
latest report per truck
every truck, one message, on a clock
Following report 4188 from Truck 7
keep latest a newer one replaces an older one
batch many go on together
each frame replaces the last
a queue, or one slot per truck
one call per report, per truck, or for all
one page timer, 100 or 250 ms
Blazor Server or WebAssembly?
WebAssembly (this talk): C# runs in the browser
Blazor Server: C# runs on the server
over the circuit→✕serialize #1
Pick Server when
Internal app, reliable network, modest messages.
Pick WebAssembly when
It must stay usable through a disconnect.
The latest report, into one frame
// FleetDashboard.Shared · Telemetry.cs public sealed record VehicleReport( int VehicleId, long Sequence, DateTimeOffset ObservedAtUtc, double Longitude, double Latitude, double SpeedKph, string RouteId);
// One frame carries the whole roster public sealed record FleetFrame( Guid RunId, long FrameSequence, DateTimeOffset PublishedAtUtc, IReadOnlyList<VehicleReport> Vehicles);
Fields → one marker
Longitude, Latitude → point geometry
VehicleId → object ID and attributes
SpeedKph, ObservedAtUtc → details and staleness
Frame-level, not vehicle-level
RunId changes on a server restart and on a reset, so old sequence numbers stop counting.
Send the latest when you're ready
built when sent, nothing queued
to all clients
// FleetBroadcaster.cs · abbreviated using var timer = new PeriodicTimer(FrameInterval()); while (await timer.WaitForNextTickAsync(stoppingToken)) { // a slow send delays the next tick; missed ticks are not replayed await BroadcastAsync(_frameBuilder.CreateFrame(), stoppingToken); // re-read the frame rate each tick TimeSpan interval = FrameInterval(); if (timer.Period != interval) timer.Period = interval; }
Learn more: PeriodicTimer
The browser keeps the newest frame
deserialized10 a second at stress
Under stress the page reads about 2 of every 10 frames.
Map, layer, feature
oid, vehicle, speedKph, route, statusFeatureLayerThe routes: a
GraphicsLayer// FleetMap.razor · abbreviated <MapView OnClick="SelectAtPoint"> <Map> <GraphicsLayer Title="Stored demonstration routes" /> <FeatureLayer Title="Fleet vehicles" ObjectIdField="oid" ... /> <GraphicsLayer Title="Selected vehicle" /> </Map> </MapView>
ObjectIdField names the attribute GeoBlazor pairs with a stable Graphic.Id to update the right feature.
An edit is one ApplyEdits call.
Learn more: docs.geoblazor.com
Implementation #1 · in the browser Every report goes to the map
// VehicleGraphicFactory.cs · abbreviated: one graphic per report new Graphic(new Point(vehicle.Longitude, vehicle.Latitude), attributes: new AttributesDictionary(new Dictionary<string, object?> { ["oid"] = objectId ?? vehicle.VehicleId, ["speedKph"] = vehicle.SpeedKph, ["status"] = vehicle.Status.ToString() })) { Id = graphicId ?? Guid.NewGuid() };
// FleetMap.razor · ApplyVehicleDelta, abbreviated FeatureEditsResult result = await _vehicleLayer!.ApplyEdits( new FeatureEdits { UpdateFeatures = updates }, cancellationToken: _lifetime.Token);
Raw queue · first in, first out
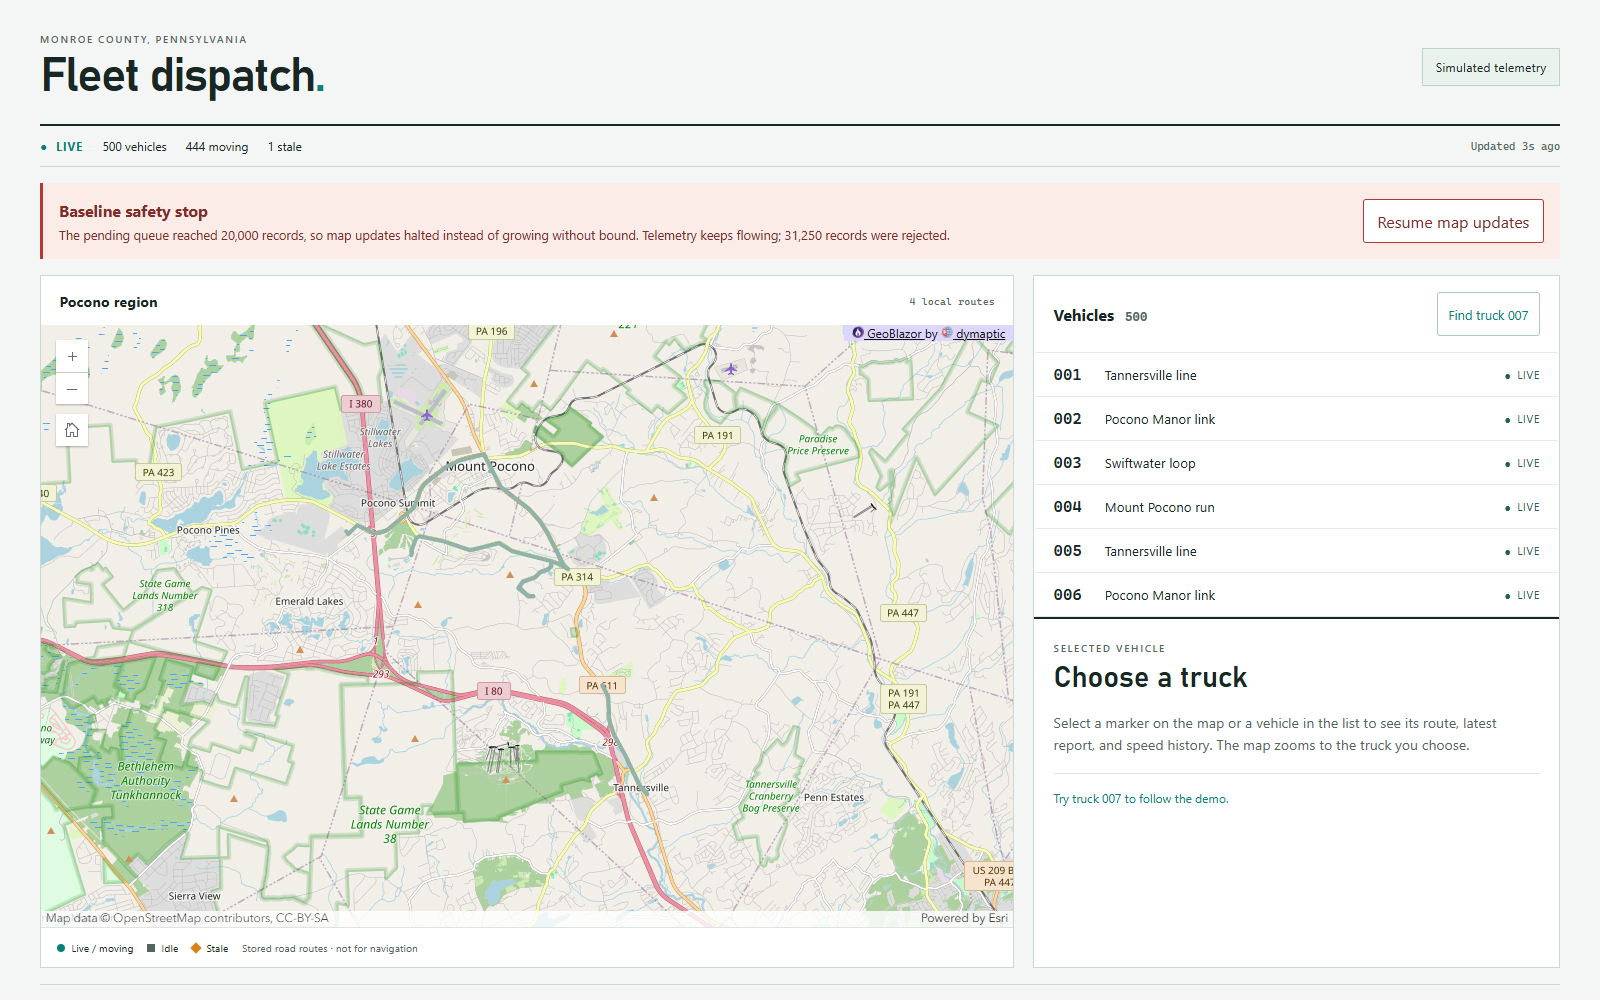
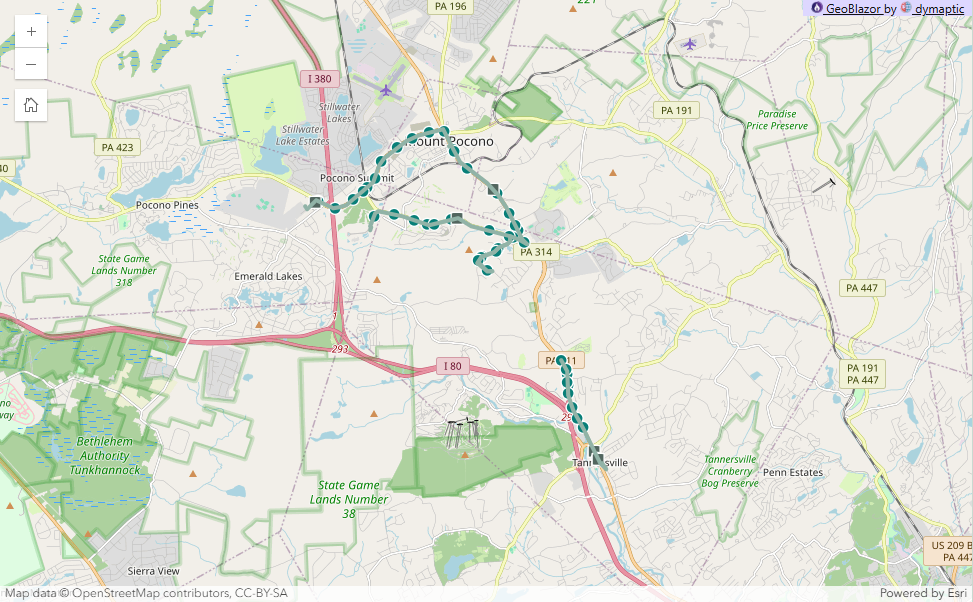
baseline: the safety stopStage 5 · the second batch Map edits: one call for every truck
Before · one awaited edit per feature
foreach (VehicleListItem update in updates) { await ApplyVehicleDelta([update], []); RemoveAppliedDelta([update], []); appliedCalls++; }
After · one awaited collection edit
// FleetMap.razor · DrainUpdates, EditGranularity branch await ApplyVehicleDelta(updates, removals); RemoveAppliedDelta(updates, removals); appliedCalls++;
500 map edits become 1 call, then 3 chunks
Honest result: under 1 truck a second became 30 to 70. But each call now takes 4 to 6 s, so every truck still waits.
More trucks a second is not a smoother map.
Roads we tried
: a margin, not a multipleGraphicsLayerin a loop: 2 of 40 trucks still clickableSetSource
Cadence
Every tick of the page timer
- Reads the newest frame and updates fleet state
- Hands the map the pending batch, and redraws the chart and counters
- The chart keeps 60 samples; the counters report over a 5-second window
Map calls a second: about 0.19 at 100 ms, about 0.20 at 250 ms. One edit outlasts either interval.
Where does the time go?
Implementation #5 · server and browser Experiment Only send what the map can see
InsideFull rate, every frame.
OutsideOnce a second, so the list stays complete.
Selected truckFull rate, wherever it goes.
Still safe
Every truck still arrives once a second.
Result: ⅔ less data. Edit time within the noise (4.8 → 4.3 s median).
Better answer: StreamLayer, once GeoBlazor wraps it.
Compare the same workload
Time for one map update · median
Stress load: 500 trucks, 10 reports a second each
- #1 every report1.4 s1 truck per call
- #2 latest1.4 s1 truck per call
- #3 batched6.4 severy changed truck in one call
- #4 scheduled4.8 severy changed truck in one call
- #5 zoomed in4.3 severy changed truck in one call
- #5 full region5.0 severy changed truck in one call
| # | Browser keeps | Map update | Server sends |
|---|---|---|---|
| 1 | raw queue, 20,000 cap | one call per report | every frame |
| 2 | latest per truck | one call per truck | every frame |
| 3 | latest per truck | one call per batch | every frame |
| 4 | latest per truck | one batch, 250 ms | every frame |
| 5 | latest per truck | one batch, 250 ms | only what the map sees |
Streams someone else hosts
NOAA weather radarfree · refreshes every 5 minutes
NWS watches and warningsfree · refreshes every 3 minutes
TrafficEsri · needs an ArcGIS API key · every 5 minutes
| Someone else's stream | Your stream | |
|---|---|---|
| Code | a refresh interval | a store, frames, and the stages after them |
| How often it changes | theirs | yours |
| Format | theirs | yours |
| Filtering | not at the source | stage 2, per connection |
Learn more: ArcGIS Living Atlas
Connected does not mean current
Stale after 5 s
Measured from ObservedAtUtc, never from frame receipt. Checked again on every page tick.
Reconnect rules
Auto-reconnect for dropped transports · merge by sequence · RunId guards resets · no replay
What to take home
viewport per connection: about 60% fewer trucks, no fasterbaseline every report: fell overlatest one slot per truckbatched one call for all the trucksscheduled a 250 ms tickThe server batches and thins the data before the browser sees it, so the browser's job is to keep that work, not undo it, and under stress the change that clearly helped was sending less.
Questions
Sample code and write-up
https://timpurdum.dev/post/2026/10/15/techbash.html

Running the sample
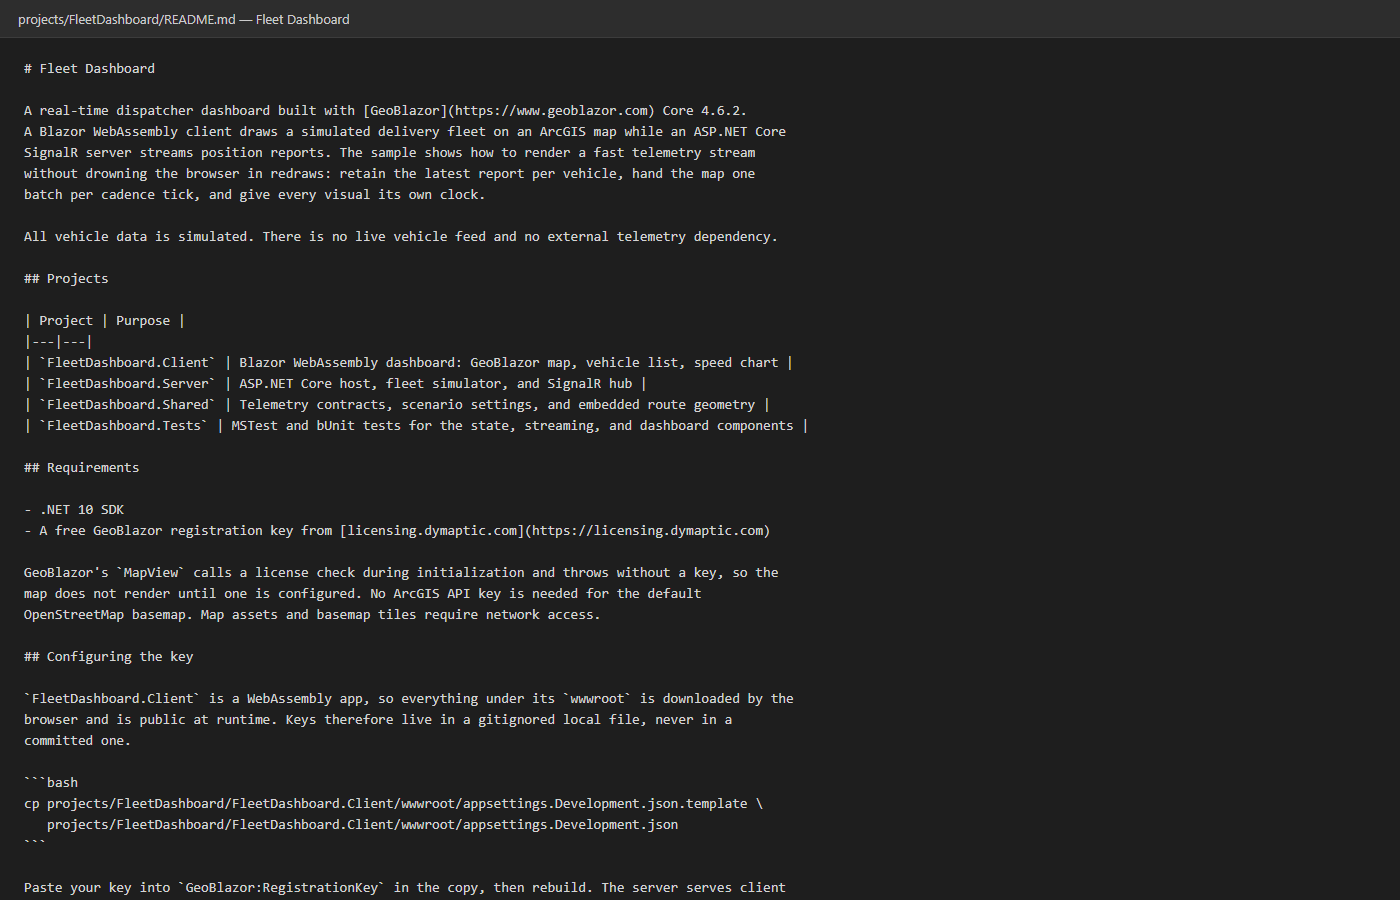
Core registration
builder.Services.AddGeoBlazor(builder.Configuration);
Core registration and ArcGIS authentication are separate concerns.
Configuration keys
GeoBlazor:RegistrationKey
GeoBlazor:LicenseKey (fallback)
ArcGISApiKey (optional · turns on traffic)
No real key is committed. Presenter credentials never ship.
Checkpoints
One launch serves every mode through ?mode=, so recovery is a URL, not a branch.
What changes for Interactive Server?
- The SignalR hub is not needed: the circuit already is the connection.
- Both models own their state and cleanup; on Server, per-user state lives on the server and every update crosses the circuit.
- Circuit messages default to 32 KB, and GeoBlazor's own Server samples raise that limit.
- Do not add a same-process hub client just to imitate the WebAssembly architecture.
Measurement definitions
| Metric | Definition |
|---|---|
| Records / s | vehicle reports in newly observed frames; a repeated frame adds nothing |
| Pending records | raw queue size in baseline; dirty vehicle count in optimized modes |
| Replaced state | pending reports replaced by a newer report for the same vehicle |
| Application map calls / s | calls to FeatureLayer.ApplyEdits, not JavaScript calls |
| Features submitted / s | feature edits passed to the adapter, by add, update or delete |
| Edit duration | monotonic elapsed time around the awaited call, including internal chunks |
| Selected observation age | now minus the last successfully applied observation time |
| Failure count | failed feature edits and failed batches |
| Reconnects | client reconnect events, a separate counter |
| Received frames / s, receipt-to-apply delay | defined in the demo plan, not measured |
Protocol
Release build, same seed and preset, 30 s warm-up, 60 s per mode, three repeats, counters reset between runs. The viewport runs fix the map extent: one zoomed on the selected truck, one at the full region.
Environment
Run 2026-09-17 · Dell XPS 8960
Build Release · .NET 10 · Core 4.6.2
Chunk size 200 features
Browser Chromium 153, headed, RTX 3050
Window 30 s warm-up · 60 s run · 3 repeats
Workload 500 vehicles · 10 frames/s
Full record of the 2026-09-17 four-mode run, not the later run in the main talk: assets/measurement-environment.txt. Paint rate was not measured.
Beyond the sample
Durable event history
Keep an append-only record when replay and audit matter more than freshness.
Authorization
Decide who may see which vehicles before the frame leaves the server.
Routing
Routing chooses a path. This demo follows stored paths and claims nothing about legal truck access.
StreamLayer
Coming in a later GeoBlazor release, it moves the live feed into the map itself.
These are named expansion points, not features hidden in the demonstration.
Choosing the update path
The JavaScript engine is not the constraint
A JavaScript-only control moved the same 500 points: one collection call took 10.9 ms at 119.5 fps and a single-feature call 0.1 ms. A JavaScript GraphicsLayer matched it on throughput only; GeoBlazor's own was not measured. A tenfold drop in offered records cut the dashboard's edit p50 from 2.3 s to 0.2 s (2026-09-19), so receive work dominates.
Three paths GeoBlazor exposes
- One collection
FeatureLayer.ApplyEditscall: today's path, chunked at 200 graphics. FeatureLayer.SetSource, a bulk replacement: data stayed current but the rendered view desynced. After 40 calls, hit testing returned the vehicle's own feature for 2 of 40 and some feature for 27 of 40. A call took about 994 ms against 154 ms forApplyEdits: context only, not a timing result.- A
GraphicsLayer: one interop call per graphic, no bulk update, no renderer.
Measure before choosing
- Visible movement, current attributes and status
- Same object identity, working hit testing and selection
- Join and leave handling
Keep one edit in flight. Quote no timing before all of it.
No stream layer in 4.6.2
GeoBlazor 4.6.2 wraps no StreamLayer, the layer Esri designed for this. Keeping FeatureLayer also keeps the UniqueValueRenderer, the ObjectIdField, and queryFeatures.
Paint rate was never measured. Software and hardware WebGL runs of batched recorded the same edit durations, and edit duration excludes painting.